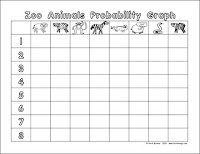
This graph was designed to be completed in a whole group situation as part of the “Calendar Book” activity we looked at last week, but really could be used in many different settings and sizes of groups. The idea is that the children discover that the probability of choosing any of the animals remains the same each time a card is drawn. This is because each time a card is drawn, it is thrown back into the basket for the next time. I’ve attached the files and art for this activity here.
To prepare, duplicate a copy of the graph for each child. Duplicate and cut apart one copy of the animal cards for the teacher or leader of the group. Mix the cards up and put them in a basket or bag.
2. Have the children take turns picking one of the animal cards out of a basket or tub with his or her eyes closed. Have the child that picked the animal name it. Then, all of the children should color in one square under that animal on his or her graph. The animal card that was picked should be placed back into the basket with the other cards, so that the probability of picking any one of the eight cards remains the same each time a card is drawn.
3. This activity is much more fun if you use real plastic animal toys rather than animal cards, but the children soon get to the point where they can actually tell which animal they are choosing by the way it feels! So this sort of defeats the purpose of the activity! But if you can find a way to randomly give them an animal without letting them actually identify the toy by touching it, then go for it! But please- let us know how you did it!


